Turnaround variance root causes in radiology reporting
Turnaround variance root causes in radiology reporting include definitions, staffing, modality mix and handoffs, and here is how to find each one.
Turnaround variance root causes in radiology reporting fall into five groups: inconsistent definitions, staffing and workload, modality and priority mix, handoff and technology friction, and unmanaged outliers. Turnaround variance is the spread between your fastest and slowest report times for comparable studies. You find its cause by splitting the timeline into intervals and comparing each one by modality, priority and hour of day, then fixing the interval that drifts rather than the average.
Key facts
- The AHRA lists five commonly tracked turnaround intervals, from order-to-final-report to critical-finding-to-notification (2025).
- A closed-loop critical results system raised compliance with a 60-minute target for life-threatening tests from 35% to 99% in a project published by RSNA (2011).
- A variability-reduction project cut emergency department doc-to-disposition time from 88.7 to 79.8 minutes (RSNA, 2011 to 2012).
- Study flow measured over 30-minute and 60-minute RVU intervals correlated significantly with report turnaround in an academic department (AJR, 2013 to 2014 data).
- Emergency department CT delays in a 2021 root cause analysis were tied to IV access, contrast allergies, GFR concerns and imaging protocols (PubMed Central).
TL;DR
- Define turnaround time the same way everywhere, or the comparison between sites and shifts means nothing.
- Report medians and spread by modality, priority and hour, never a single facility-wide average.
- Separate normal variation from a specific event before you launch an improvement project.
- Daily comparative reporting, clear priority levels and extra call coverage have measurably narrowed variability in published projects.
- When volume or off-hours coverage is the cause, a contracted teleradiology partner can absorb it under written SLA terms.
Table of Contents
- Who wrote this guide, and what is our interest?
- What are the root causes of turnaround variance in radiology?
- How should you define turnaround time before comparing it?
- Which factors make radiology turnaround times vary?
- How do you tell normal variation from a specific bottleneck?
- What data do you need to find the root cause?
- Which workflow changes make turnaround more consistent?
- When is outsourcing the right fix for turnaround variance?
- What does AstraRad commit to on turnaround and quality?
- How can AstraRad help you act on this analysis?
- Common mistakes when analyzing turnaround variance
- FAQ
- Sources
Who wrote this guide, and what is our interest?
AstraRad is a US teleradiology service that delivers final signed reports read by board-certified subspecialists. We wrote this guide as a company that sells teleradiology services to hospitals, imaging centers and radiology groups, so we have a commercial interest in the coverage and overflow topics it touches. We keep the diagnostic advice neutral: most variance causes are fixable inside your own department, and we say which ones. Where outside coverage is the right lever, we say that too.
What are the root causes of turnaround variance in radiology?
The root causes of radiology turnaround variance are differences in how time is measured, uneven staffing and workload, mixed modalities and priorities, technology and handoff friction, and one-off events. Turnaround time (TAT) is the elapsed time between two defined points in the imaging workflow, such as exam completion and final report. Variance appears when the same interval behaves differently across studies, shifts or sites.
The AHRA attributes variability to modality, facility type and location, priority level, equipment capabilities, hour of day and staffing levels. That list is useful because it shows variance is rarely one problem. A department with a slow Tuesday afternoon and a department with a slow Saturday night usually have different causes and different fixes.
How should you define turnaround time before comparing it?
You should define turnaround time as a named interval with a fixed start and stop timestamp, and use that same definition for every site, radiologist and reporting period. Facilities that measure from different starting points will show different performance regardless of how efficient they are, which is why the AHRA calls for standardized definitions to benchmark accurately.
Radiologists often think from image availability to signature. Administrators often think from order to final report. Both are valid, but they answer different questions. The intervals below are the ones commonly tracked.
| Interval | Start | Stop | What it tells you |
|---|---|---|---|
| Order to exam start | Order placed | Exam begins | Scheduling and patient flow |
| Order to final report | Order placed | Final report signed | The full experience for the referring clinician |
| Exam completion to preliminary report | Exam ends | Preliminary read issued | Early availability for urgent decisions |
| Exam completion to final report | Exam ends | Final report signed | Reading and sign-off performance |
| Critical finding to notification | Finding identified | Clinician notified | Communication safety |
A final signed report is the authenticated, completed interpretation of a study by a radiologist, as opposed to a preliminary read. Say which one your clock stops on. A contract should also state it. When we commit to turnaround at AstraRad, the clock runs from last-image arrival to radiologist signature, and that is the kind of explicit boundary every SLA needs.
Which factors make radiology turnaround times vary?
Radiology turnaround varies most with modality, priority, hour of day, staffing, case complexity and the number of handoffs before a study reaches a reader. Each factor shows up in a different interval, so the first job is matching the symptom to the stage of the workflow where it appears.
| Factor | How it shows up | Where to look |
|---|---|---|
| Modality | MRI and multiphase CT take longer to read than a chest X-ray | TAT by modality and body part |
| Priority level | STAT studies read fast while routine studies wait and age | TAT by priority, medians and 90th percentile |
| Hour of day | Overnight and weekend slowdowns | TAT by hour and day of week |
| Staffing | Fewer readers on shift, vacancies, vacation gaps | Studies per radiologist per hour versus TAT |
| Case complexity | Oncology follow-ups, neuro and cardiac studies | TAT by subspecialty |
| Image transmission | Late or incomplete image arrival from modalities | Exam completion to image availability |
| Trainee involvement | Resident drafts and attending review | TAT by reader type |
Research from academic departments backs this up. A review from Johns Hopkins names image transmission, case complexity, reporting practices and trainee participation as influences on report turnaround, with staffing shortages and workflow inefficiencies adding delay. An analysis in the AJR found that RVU flow over 30 and 60-minute intervals, the attending radiologist and the presence of a resident were significantly correlated with report turnaround (2013 to 2014 data).
What delays happen before the radiologist ever sees the study?
Many delays begin upstream of the reading room. In a root cause analysis of delayed emergency department CT, researchers associated delays with patients who were medically unstable or unable to cooperate, IV access problems, contrast allergies, GFR concerns and imaging protocols (2021). None of those are reading problems, yet they all lengthen an order-to-report interval.
This matters for variance. If you measure only exam completion to signature, you will miss them. If you measure only order to report, you may blame radiologists for what is really a scanner-side or patient-prep issue.
How do you tell normal variation from a specific bottleneck?
You tell them apart by checking whether a delay sits inside the usual range of your own history for that modality, priority and hour, or outside it with an identifiable event behind it. Common-cause variation is the routine spread built into a stable process. Special-cause variation is a deviation from an identifiable, assignable event, such as an equipment failure, a staffing gap or a handover problem.
The distinction changes what you do. Chasing common-cause variation with one-off fixes wastes effort and can make the spread worse. Ignoring a special cause lets it repeat. A practical way to separate them:
- Segment first. Build a baseline for each modality, priority and hour block. A 3 a.m. MRI and a 2 p.m. chest X-ray should never share a baseline.
- Use medians and a spread measure. The AHRA recommends median values so outliers do not distort the assessment. Add the 90th percentile to see the tail.
- Set control limits from your own history. A control chart plots each period against limits calculated from past performance. A point outside the limits, or a run of points trending one way, signals a special cause.
- Look for the event. Match each flagged period against staffing schedules, downtime logs, PACS or RIS updates, protocol changes and unusual volume.
- Test the explanation. If you believe a vacancy caused the spike, check whether TAT improved when the shift was covered. If it did not, keep looking.
A pattern that repeats at the same hour every week is a structural cause, even if each occurrence looks like an accident. A single spike that never returns is usually an event. Both deserve a record, but only the first needs a process change.
What data do you need to find the root cause?
You need timestamped data from your RIS and PACS that can be split into intervals, then filtered by modality, priority, location, reader and hour. The AHRA notes that these systems can track timestamps automatically and segment turnaround into meaningful intervals, which is how bottlenecks become visible.
A workable minimum dataset includes:
- Order, arrival, exam start and exam end times
- Image availability in PACS
- Preliminary and final report times
- Priority level assigned at order and any later change
- Modality, body part and ordering location
- Reader, shift and whether a trainee was involved
- Critical result notification time
Data quality comes first. Priority labels that clinicians pick inconsistently, timestamps entered by hand and reports finalized in batches at shift end all create artificial variance. Audit these before you build dashboards. A batch-signing habit alone can make a fast reader look slow and a slow reader look fast.
Which workflow changes make turnaround more consistent?
The changes with the best published evidence are clear priority levels, daily comparative reporting, extra coverage on call shifts, coaching and closed-loop communication of critical results. A quality project published by RSNA used five exam priority choices, daily comparative TAT reports, double coverage for call shifts and efficiency coaching, and it reduced both mean turnaround and its variability (2011).
The same project reported that a closed-loop system for critical test results, which automated documentation of communication, lifted compliance with the 60-minute target for life-threatening findings from 35% to 99% (2011). A related RSNA project focused on turnaround variability reported a drop in emergency department doc-to-disposition time from 88.7 to 79.8 minutes (2011 to 2012). These are results from specific institutions, not promises for yours, but the mechanisms are transferable.
Why does daily comparative reporting help?
Daily comparative reporting is the practice of showing each reader or section their turnaround against peers every day. The quality improvement team behind the RSNA project credited transparency of this kind with changing staff behavior and narrowing departmental variability. It works because it turns an invisible spread into something a reader can act on the same week.
Should you set tighter targets?
Set realistic, evidence-based targets rather than arbitrary ones. The AHRA recommends this approach and advises using medians. A target that your own data shows is unreachable at 3 a.m. teaches staff to ignore the metric, which widens variance instead of closing it.
When is outsourcing the right fix for turnaround variance?
Outsourcing is the right fix when the root cause is capacity: volume spikes, vacancies, overnight and weekend gaps, or subspecialty studies without a local reader. Teleradiology is the interpretation of diagnostic images by a radiologist at a different location than where the images were acquired. It does not fix upstream causes like IV access, protocol problems or mislabeled priority.
Use your segmented data to decide. If variance clusters at specific hours, in specific modalities or during volume surges, capacity is likely the cause. If it clusters in order to exam start, look at scheduling and patient prep first.
| Root cause pattern | Likely fix | Does outsourcing help? |
|---|---|---|
| Variance clusters overnight or on weekends | Extend coverage hours | Yes, through weekend and holiday coverage |
| Backlog after volume surges | Add reading capacity | Yes, through overflow radiology reads |
| Slow STAT turnaround at night | Dedicated STAT pathway | Yes, through STAT radiology reads |
| Long order to exam start | Scheduling, prep, transport | No |
| Inconsistent priority labels | Order set redesign | No |
| Late image arrival in PACS | Modality and network fixes | Partly, a partner needs complete images too |
When you buy outside capacity, write the measurement boundary into the contract. A service level agreement (SLA) is a written contract term that commits a provider to defined turnaround times, measured from a stated start point to a stated stop point. A business associate agreement (BAA) is the HIPAA contract that governs how a vendor handles protected health information on your behalf. Procurement should also ask about credentialing and licensure in your state, PACS integration method, and how the vendor measures quality.
What does AstraRad commit to on turnaround and quality?
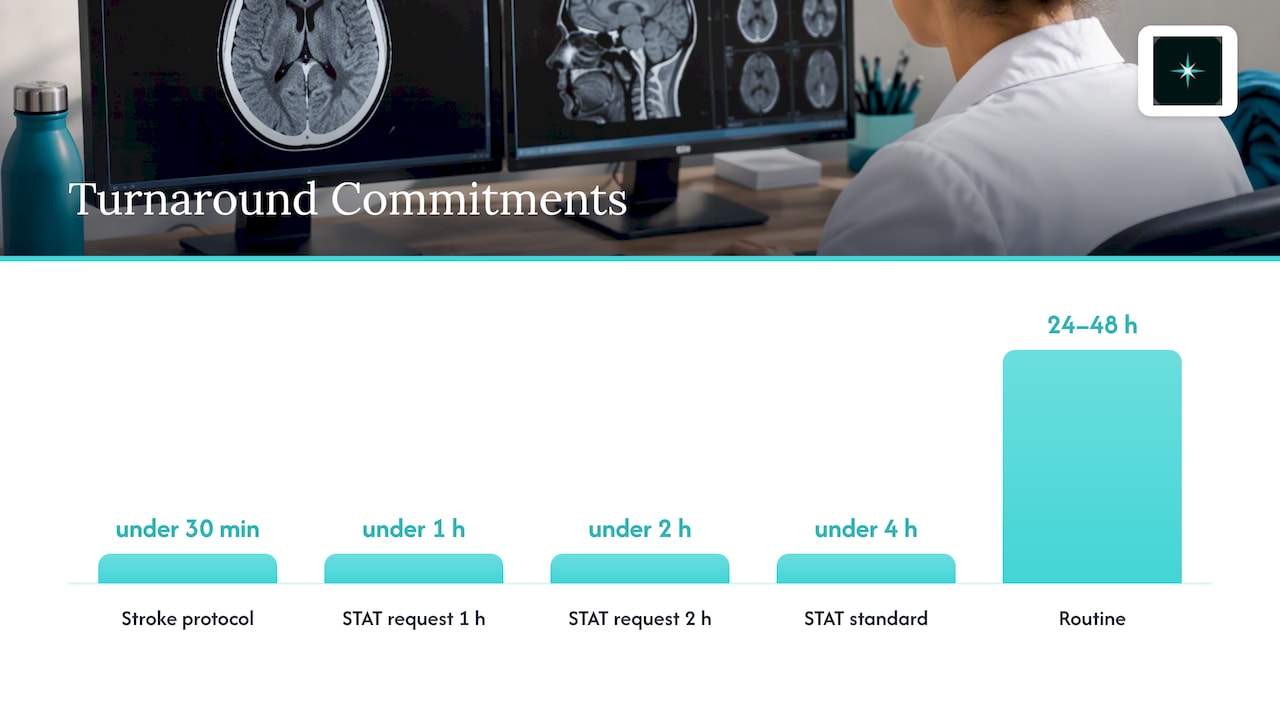
AstraRad is a US teleradiology service that delivers final signed reports read by board-certified subspecialists. Turnaround is committed by contract and measured from last-image arrival to radiologist signature: STAT under 4 hours (under 2 hours or under 1 hour on request), routine 24 to 48 hours, and stroke protocol under 30 minutes. Every study is routed to a subspecialist matched to the modality and body part, and every read is performed inside the United States on scheduled shifts, 24/7/365.
For variance, the design choices that matter are these:
- Final signed reports at every tier, including overnight, so there is no preliminary-to-final gap to chase.
- Radiologists licensed in all 50 states, which removes state credentialing as a source of delay.
- Blind double-reads on 1 in 20 reports for peer review.
- Delivery into your existing PACS, DICOM conformant, with no extra portal for staff to open.
- Per-report pricing with no minimums, so you can route only the volume that causes variance.
See how the workflow runs from your PACS to a signed report, or review STAT CT reads if overnight head and trauma CT is where your tail delays sit.
How can AstraRad help you act on this analysis?
AstraRad is a US teleradiology service that delivers final signed reports read by board-certified subspecialists. If your segmented data shows capacity-driven variance, we can take defined studies, such as overnight CT, weekend volume or a backlog, under a contract with SLA terms in writing and a signed BAA. The first signed report arrives within 10 business days of countersignature.
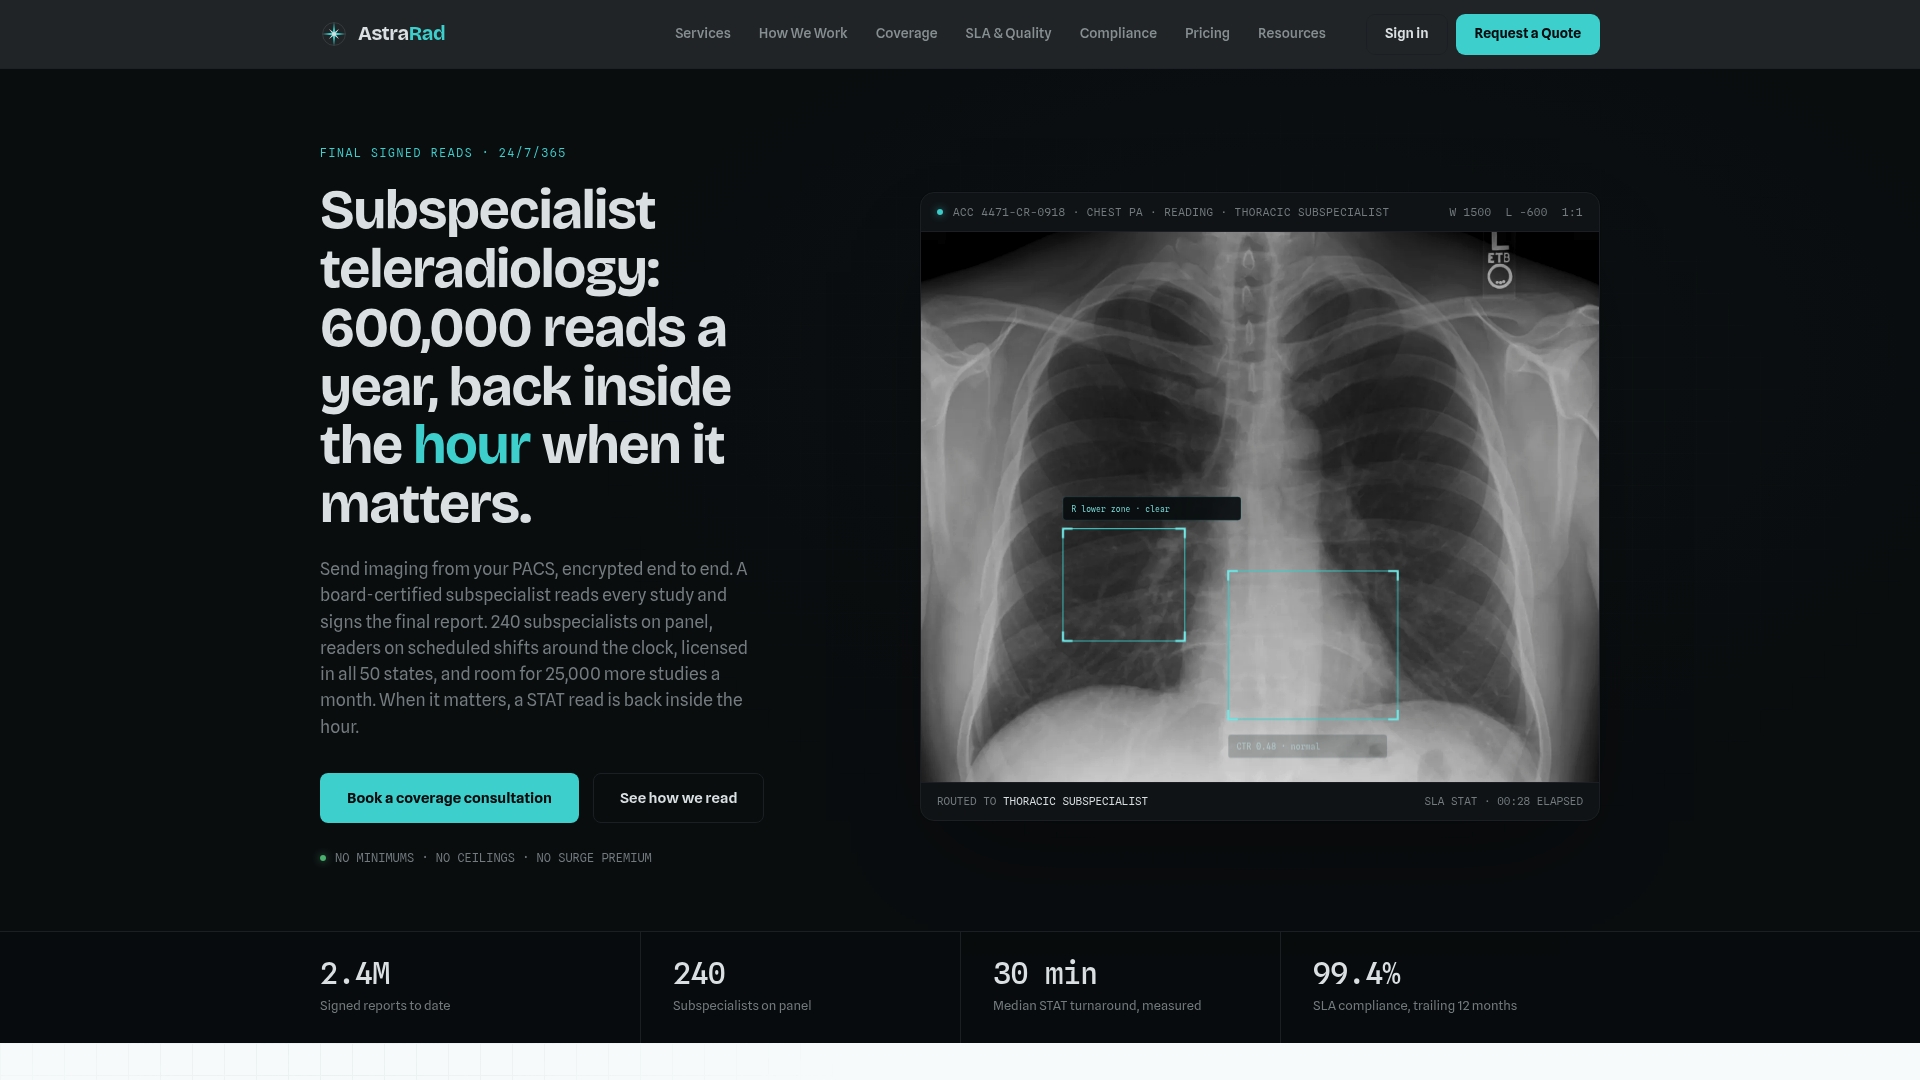
Start with a discovery call to share your modality and priority mix. A complete per-report rate card is delivered within one business day on request, and a coverage plan with SLA terms follows the call. Explore the full range of teleradiology services to see which modalities fit.
Common mistakes when analyzing turnaround variance
The most common mistake is relying on one facility-wide average. Averages hide the overnight tail, the weekend dip and the modality that drags. The research summary from administrators is consistent: metrics must be segmented by modality, priority and clinical setting to be meaningful.
Other mistakes recur:
- Mixing definitions. Comparing order-to-report at one site with exam-complete-to-report at another.
- Treating every spike as an incident. Normal variation then gets blamed on individuals.
- Ignoring upstream causes. Reading time gets the blame for patient prep or protocol delays.
- Setting targets without baselines. Staff stop trusting the number.
- Skipping the critical results loop. Fast reads mean little if notification is slow.
FAQ
What is turnaround variance in radiology?
Turnaround variance in radiology is the spread in report times for comparable studies, measured between two defined workflow points. Two sites can share the same average and still differ sharply in variance. High variance means referring clinicians cannot predict when results will arrive, which matters most for STAT and emergency department studies.
What is the most common root cause of radiology turnaround delays?
No single cause dominates. Published sources point to staffing levels, hour of day, modality, priority level, case complexity and upstream issues like IV access or protocol problems. Segment your data by modality, priority and hour to find which factor drives delay in your own department rather than assuming a universal answer.
How do I know whether a slow day is normal variation?
Compare it with your own baseline for the same modality, priority and hour block. If the result sits inside the usual range, it is normal variation. If it falls outside control limits or follows a repeating pattern, look for an event such as a vacancy, downtime or volume spike.
Should we use average or median turnaround time?
Use the median, and add a percentile such as the 90th for the tail. The AHRA recommends medians because outliers can distort averages. A few very delayed studies can make a department look slow, while a batch of fast routine reads can hide STAT delays.
Can teleradiology reduce turnaround variance?
It can when the cause is capacity, such as overnight gaps, vacancies or volume surges. AstraRad is a US teleradiology service that delivers final signed reports read by board-certified subspecialists, with turnaround committed by contract. It will not fix scheduling, patient prep or priority labeling inside your facility.
Sources
- Evaluating Turnaround Time for Medical Imaging Studies, AHRA
- Root Cause Analysis of Delayed Emergency Department CT, PubMed Central
- Optimizing Timeliness of Healthcare Delivery in Diagnostic Radiology, Johns Hopkins
- Effect of Radiology Study Flow on Report Turnaround Time, AJR
- Radiology Critical Test Results Management, RSNA
- Reducing turnaround time variability project, RSNA
Recommended
Related on AstraRad
- Resources
DICOM TLS encryption: how to secure imaging traffic
DICOM TLS encryption secures imaging traffic in transit, covering profiles, TLS versions, certificates, and checks hospitals and imaging centers need.
- Resources
Teleradiology compliance checklist for US buyers
Use this teleradiology compliance checklist to vet licensure, credentialing, HIPAA safeguards, BAA terms and SLA language before you sign a contract.
- Resources
PACS firewall rules for radiology: a practical guide
PACS firewall rules for radiology explained, covering network zones, DICOM ports, remote access, HIPAA duties, and testing for hospital buyers.
Put a radiologist's name on your next read.
Tell us your modalities and monthly volume. A complete per-report rate card, with turnaround tiers and SLA terms in writing, lands in your inbox within one business day.