90 day QA checklist to lower discrepancy rates
Compare real-time (3,5%) and audit (20,30%) discrepancy rates. Use evidence-backed benchmarks, KPIs, and a 90 day QA pilot to reduce misses and guide
Real-time radiology discrepancy rates run around 3 to 5% of studies in routine reporting, but retrospective double reads on the same cases often push discordance up to 20 to 30%, particularly in cross-sectional imaging. The gap isn't a measurement error. It reflects how much hindsight, dedicated review time, and a second set of eyes change what gets flagged. If you run quality assurance for a radiology group, the immediate move is to stop treating discrepancy rate as one number and start tracking it by modality and study type, since that's where the actionable signal lives.
TL;DR:
- Discrepancy rates are significantly higher in retrospective audits, reaching up to 26-32%, due to hindsight bias and case selection, not carelessness.
- Cross-sectional studies like CT and MRI generally show higher discordance than plain radiographs, especially in complex or high-volume settings.
- The majority of diagnostic errors stem from perceptual misses, which make up about 60-80% of mistakes, and are influenced strongly by workload and fatigue factors.
- Effective QA measures include modality-specific discrepancy tracking, blind double reading of high-risk studies, and targeted feedback to reduce interpretative errors over time.
- Outsourcing overflow and after-hours coverage with subspecialist support can address workload-induced perceptual errors more swiftly and flexibly than expanding internal staffing.
Table of Contents
- What counts as a radiology discrepancy rate, and how do you classify it?
- How common are radiology discrepancies across different studies?
- What causes radiology discrepancies?
- How should QA teams measure discrepancy rates reliably?
- What actually reduces radiology discrepancy rates?
- Building a 90-day QA pilot: checklist and targets
- How subspecialist coverage and peer review support discrepancy reduction
- Why discrepancy rates carry patient safety and legal weight
- Communication and feedback loops that actually change behavior
- How do discrepancy rates compare across health systems internationally?
- Leading QA change without turning it into a witch hunt
- Closing radiology coverage gaps with subspecialist support
- Sources
- FAQ
What counts as a radiology discrepancy rate, and how do you classify it?
A discrepancy is a difference of opinion between two readers that a reasonable radiologist could defend given the same information. An error is different: it's a miss or misinterpretation with no reasonable justification, the kind of finding that a peer reviewing the same images would flag without hesitation. Conflating the two is the single most common flaw in home-grown QA programs, because it inflates "error" counts with routine, defensible disagreement and makes departments look worse than they are.
Radiology error taxonomy typically splits into two mechanisms:
- Perceptual errors happen when the abnormality is on the images but the reader never registers it. A missed rib fracture on a trauma CT, overlooked because attention was locked on solid organs, is a classic example.
- Interpretative (cognitive) errors happen when the finding is seen but reasoned about incorrectly. A radiologist notices a lung nodule but calls it benign scarring instead of pursuing follow up.
Perceptual misses account for roughly 60 to 80% of diagnostic errors, with cognitive and interpretative errors making up the remaining 20 to 40%. That split matters for training design: perceptual errors respond to search-pattern coaching and workload control, while cognitive errors respond better to case conferences and structured second opinions.
Most departmental QA programs also grade discrepancies by severity:
- Minor: unlikely to affect management, such as a slightly understated degree of stenosis.
- Major: would likely change diagnosis or treatment if uncorrected, like missing a new liver lesion in an oncology follow-up.
- Critical: could cause immediate harm if not corrected quickly, such as a missed pneumothorax or an unstable spine fracture.
Building your local scoring system around these three tiers, rather than a binary "error/no error" flag, gives you a discrepancy classification that actually tracks clinical consequence instead of just disagreement volume.
How common are radiology discrepancies across different studies?
Published benchmarks cluster into two very different bands depending on how the study was measured. Day-to-day clinical practice, where a single radiologist signs a report without a formal second read, produces a discrepancy rate of roughly 3 to 5%. Retrospective audits, where a second radiologist reviews the same study later, often knowing the clinical outcome, reports substantially higher discordance.
Key figure: Expert re-reads of abdominal CT samples have found major discrepancy rates as high as 26%, with intra-observer disagreement (a single radiologist disagreeing with their own prior read) reaching up to 32% in select samples.
That's not a sign that radiologists are careless a quarter of the time. It reflects hindsight bias, extra review time unavailable at the point of care, and selection of cases specifically chosen for audit because they were borderline. The number is real, but the context around it is what makes it usable.
Modality and setting drive most of the variation you'll see locally:
- CT and MRI generally show higher discordance than plain radiographs, because cross-sectional studies carry more findings per exam and more room for satisfaction of search.
- Mammography has its own well-studied double-reading infrastructure precisely because single-reader miss rates were unacceptable for cancer screening.
- Ultrasound discrepancy rates vary heavily by operator dependence and image quality at acquisition, which a second reader can't fully correct for.
- Plain radiographs tend to run lower on major discrepancy rates but higher in raw volume, so even a small percentage translates into a large absolute number of misses.
Trainee level matters too. A 2023 audit of 9,072 resident preliminary reports found a major discrepancy rate of 1.7% and a minor discrepancy rate of 8.3% when compared against the attending's final read. Discrepancy rates fell as residents advanced in seniority, and CT preliminary reads in that dataset showed lower discrepancy than MRI. Compare that against a five-year prospective audit of consultant-read acute CTs, which found a significant discrepancy rate of 1.2%. Consultant-level rates run lower than resident preliminary rates, but neither number means much without knowing case mix, coverage hours, and how "significant" was defined locally.
What causes radiology discrepancies?
Cognitive biases explain a meaningful share of interpretative misses, and they tend to repeat in predictable patterns rather than occurring randomly.
- Satisfaction of search: once a radiologist finds one abnormality, attention drops for additional findings elsewhere on the same study. A rib fracture found after a wrist fracture was already identified is a textbook version.
- Anchoring: early impressions from the clinical history or prior report skew the current read, even when the new images tell a different story.
- Availability bias: a radiologist who recently read several cases of one diagnosis becomes more likely to call the next ambiguous case the same way.
One frequently cited demonstration of how easily perceptual attention fails: in a controlled experiment, 83% of radiologists missed an image of a gorilla inserted into a chest CT while they were focused on finding lung nodules. The point isn't that radiologists are inattentive. It's that focused visual search, the exact skill radiology depends on, actively suppresses awareness of anything outside the search target.
System factors compound the cognitive ones. Workload is the best documented of these: a 2023 study on work overload found that CT addenda for perceptual errors correlated with higher normalized workload, meaning error risk climbed as reading volume per shift increased. Fatigue, overnight and weekend coverage gaps, incomplete clinical history at the time of read, and PACS or HL7 interface faults that delay prior comparisons all add measurable risk on top of the cognitive baseline.
Pro Tip: Track discrepancies against shift-level volume, not just monthly averages. A radiologist reading 20% over their typical daily volume on a given shift is a different risk profile than the same person on a normal day, and monthly aggregates erase that signal completely.
How should QA teams measure discrepancy rates reliably?
Reliable measurement starts with picking an audit design that matches your goal, then holding it constant long enough to see a trend instead of noise.
- Prospective peer review reads a sample of finalized reports in near real time, usually within days, and works well for ongoing monitoring without disrupting workflow.
- Retrospective double reading has a second radiologist re-read a batch of prior studies, typically blinded to the original report, which produces the more rigorous but higher discrepancy numbers discussed above.
- Triggered reviews activate automatically on specific events: a discharge readmission, a clinical complaint, or a follow-up study that contradicts a prior read.
- Random sampling pulls a fixed percentage of studies across all readers and modalities monthly, which is the backbone of most RADPEER-style programs.
Blinding the second reader to the original report and to the clinical outcome reduces hindsight bias and produces more reproducible numbers, a point supported by the same AJR review that documents error-type proportions. Without blinding, second readers unconsciously anchor toward agreeing or toward finding something, depending on why the case was selected.
For dashboard design, track these KPIs at minimum:
- Major discrepancy rate, tracked separately from minor discrepancy rate.
- Modality-specific rates, since a blended average hides where the real risk sits.
- Time-to-amend, meaning how long between original report and correction.
- Reviewer-level and shift-level breakdowns, to separate individual coaching needs from systemic workload problems.
Sample size matters more than most departments assume. A monthly sample of 20 to 30 studies per modality is usually the floor for detecting a real shift rather than random variation, and smaller samples should be interpreted as directional only.
What actually reduces radiology discrepancy rates?
Peer-learning programs that separate education from discipline show the strongest track record. Non-punitive peer review models build in case discussion and pattern recognition rather than a scorecard tied to performance reviews, and departments running these programs report better engagement and lower repeat-error rates than strictly punitive systems.
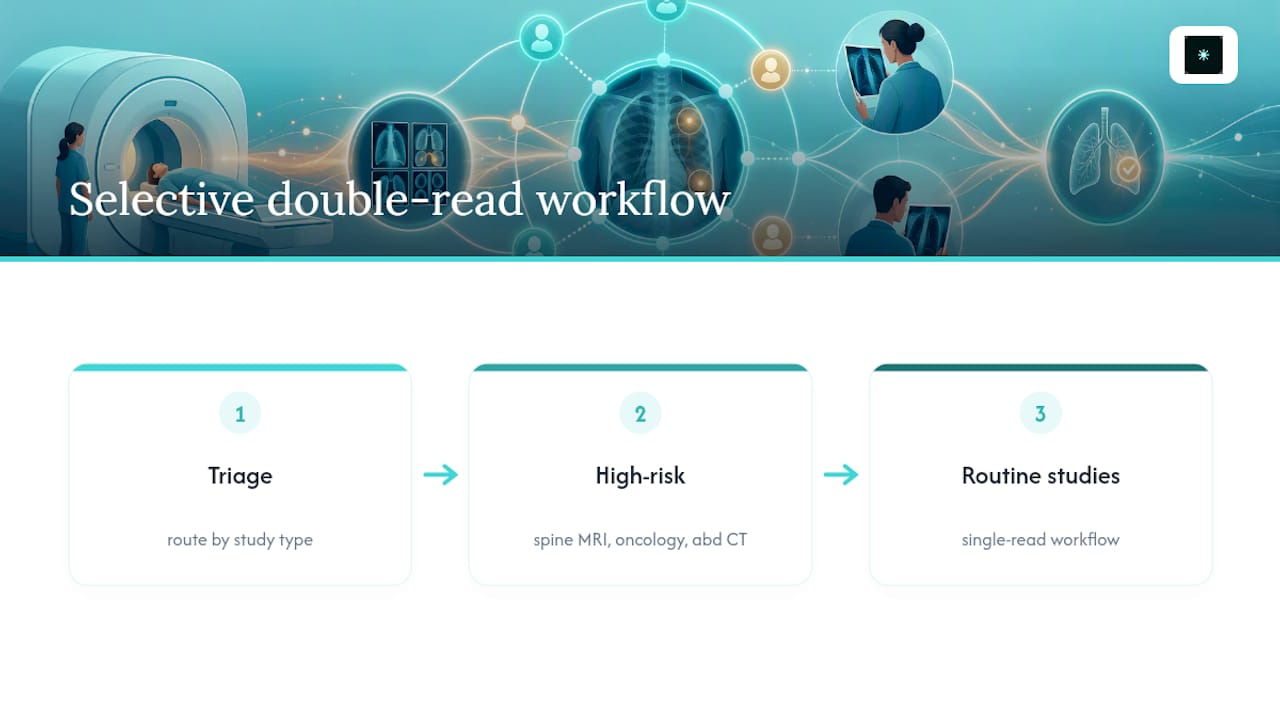
Selective double reading, rather than reading everything twice, is the more sustainable version of that discipline. Route high-risk study types, complex oncology follow-ups, spine MRI, and acute abdominal CT, through a mandatory second read, and let routine radiographs run on standard single-read workflow. This concentrates review capacity where interpretative error carries the highest clinical stakes.
Structured reporting templates and modality-specific checklists reduce omission errors by forcing a systematic scan pattern instead of relying on free recall. A checklist that prompts a radiologist to explicitly address bone windows on every trauma CT catches the satisfaction-of-search misses that unstructured dictation lets through.
Workload management and protected reporting time matter as much as any review process. If work overload correlates with more perceptual misses, the fix isn't more review after the fact. It's controlling the volume per shift that produces the miss in the first place, plus building in staffing buffers for after-hours and weekend coverage where supervision typically thins out.
AI tools have a real but limited role here. Selective AI triage for high-priority findings, like flagging suspected pneumothorax or large vessel occlusion for faster read, can shorten time-to-diagnosis on critical cases. Treat it as an adjunct that reprioritizes the worklist, not a replacement for subspecialist interpretation, since current tools are narrow by design and don't generalize across the full range of findings a radiologist covers in one study.
Pro Tip: Pilot selective double reading on one high-risk modality for 90 days before expanding. You'll learn your actual baseline discrepancy rate for that study type, and you'll know whether your reviewer capacity can sustain the added volume before committing department-wide.
Building a 90-day QA pilot: checklist and targets
A workable QA rollout doesn't require a full year of planning. It requires clear definitions and a willingness to look at real numbers before drawing conclusions.
- Write down department-specific definitions for error, discrepancy, and severity tiers before collecting a single data point.
- Assign reviewers by modality expertise, not by who has spare time on a given day.
- Set a minimum sample size per modality, generally 20 to 30 studies monthly, before trusting any trend.
- Prioritize high-risk modalities and anatomic regions, since clinically significant discrepancies cluster there rather than distributing evenly across all study types.
- Set KPI targets with tolerance bands, not single hard numbers, since month-to-month variation on small samples is expected.
- Fix a reporting cadence, monthly for dashboards, quarterly for trend review with the full department.
- Build an escalation rule for critical discrepancies: who gets notified, and within what timeframe.
- Tie every finding back to an education plan, case conferences, targeted coaching, template revisions, rather than a disciplinary file.
- Revisit definitions and thresholds every two quarters, since case mix and staffing shift over time.
| QA element | Practical target |
|---|---|
| Major discrepancy rate | Track trend, flag any rise over 2 consecutive quarters |
| Minor discrepancy rate | Track separately, expect higher volume than major |
| Sample size per modality | 20 to 30 studies monthly minimum |
| Time-to-amend on critical findings | Same-day notification to referring clinician |
| Review cadence | Monthly dashboard, quarterly full review |
A single bad month on a 15-study sample is usually noise. A rate that holds for two consecutive quarters is a trend worth acting on.
How subspecialist coverage and peer review support discrepancy reduction
AstraRad provides final signed reports through board-certified subspecialists reading within their own modality, backed by structured peer review and guaranteed turnaround, under 1 hour for STAT cases and under 24 hours for routine studies. Over the past year, AstraRad has held 99.4% SLA compliance across that reporting volume.
Those capabilities map directly onto the QA gaps discussed above. Overnight and weekend coverage gaps, where supervision thins and workload spikes, are exactly where subspecialist backup or overflow support reduces perceptual error risk. If you're evaluating vendor metrics for your own dashboard, pair turnaround SLA figures with clinical-discrepancy KPIs. A fast median read time only strengthens your QA program if the discrepancy rate on those studies stays at or below your internal baseline, not just when the report arrives quickly.
Why discrepancy rates carry patient safety and legal weight
A missed finding rarely stays isolated to the report. A critical discrepancy, an unrecognized pneumothorax, an unstable fracture, a rapidly progressing infection, can delay treatment long enough to change outcome. That's the clinical stakes side of the equation, and it's why severity tiering matters more than raw discrepancy counts: a department with a 5% minor discrepancy rate and near-zero critical misses is in a fundamentally different position than one with a lower overall rate but a cluster of missed critical findings.
The medico-legal exposure follows the same logic. Malpractice claims in radiology cluster heavily around missed or delayed diagnoses, particularly in cases where the finding was visible on the original images and a later reviewer, often in litigation, identifies it in minutes. Documented, structured peer review processes matter here beyond their clinical value. A department that can show a consistent, non-punitive QA program with defined severity criteria has a materially stronger position than one relying on informal, undocumented case discussion.
Radiology critical results policy and radiology report addendum policy both deserve the same rigor as the HIPAA-compliant review replies for healthcare providers and the discrepancy measurement itself. A critical finding that isn't communicated to the referring clinician within a defined window, and documented as communicated, creates legal exposure independent of whether the original read was accurate. Addendum timing and wording matter too: a vague, delayed addendum reads very differently in a chart review than a prompt, specific correction tied to a clear clinical rationale.
Communication and feedback loops that actually change behavior
Radiology report consistency improves less through better individual readers and more through better feedback loops between radiologists and referring clinicians. A discrepancy caught by a surgeon reviewing images intraoperatively, or an emergency physician noticing a mismatch between the report and the clinical picture, only improves future performance if that information routes back to the original reader in a structured, timely way.
Most departments lose this loop entirely. The referring physician calls, the correction happens, and the case disappears without ever reaching the peer review log. Building a simple, mandatory intake for clinician-flagged discrepancies, distinct from formal peer review, closes that gap and often surfaces error patterns that scheduled audits miss because they're sampling the wrong cases.
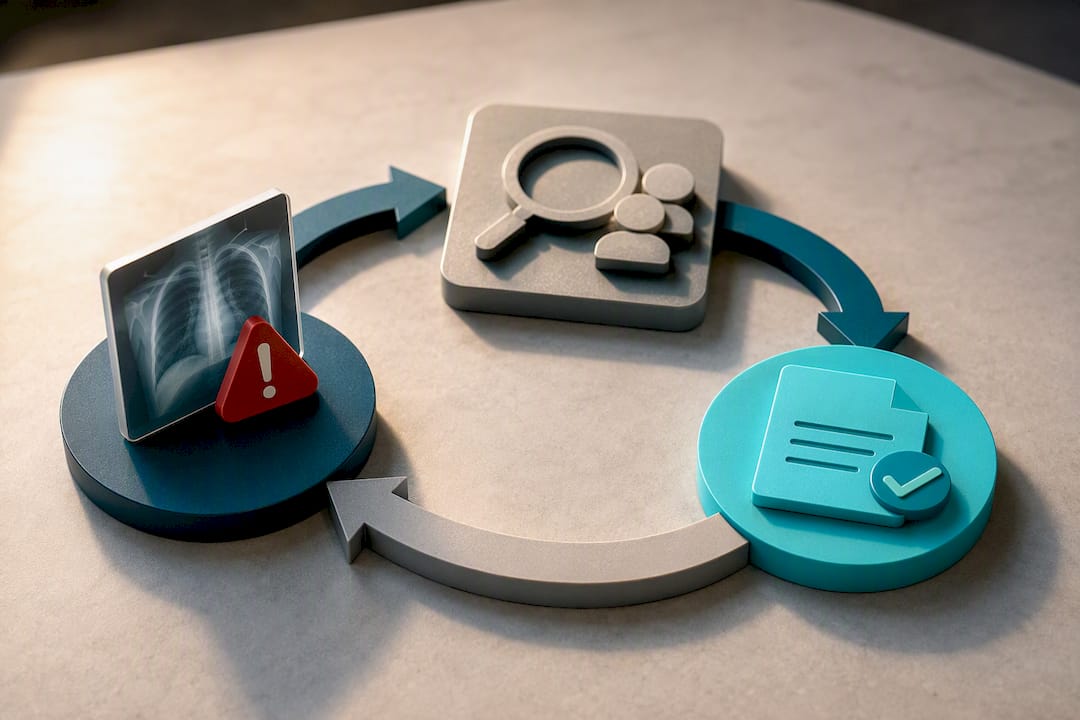
The tone of feedback matters as much as its existence. Framing discrepancy review as a shared learning exercise, rather than a performance judgment, preserves the cooperation needed to make radiologists report their own near misses voluntarily. Departments that swing toward a punitive posture tend to see underreporting rise, which quietly degrades the entire measurement system even as the visible KPI improves.
How do discrepancy rates compare across health systems internationally?
Direct international comparison is harder than it sounds, because countries and even individual health systems define discrepancy, severity, and audit sampling differently. A UK-style prospective audit measuring "significant discrepancy" at 1.2% in consultant-read acute CTs isn't measuring the same construct as a resident preliminary-report audit in a US academic center measuring major discrepancy at 1.7%. Different denominators, different reviewer seniority, different case selection.
What holds consistently across health systems is the shape of the pattern, not the exact number. Real-time single-read discrepancy sits in the low single digits almost everywhere it's been studied. Retrospective and second-read discordance runs substantially higher almost everywhere, because the audit conditions, extra time, hindsight, deliberate case selection, are structurally similar regardless of country. Resident and trainee reports consistently discrepancy at higher rates than attending or consultant reads, again independent of health system.
The practical lesson for QA leaders isn't to chase a single "global benchmark" figure. It's to build your own baseline using a consistent, documented methodology, then track your trend against that baseline rather than against a number pulled from a different country's audit design with different definitions underneath it.
Leading QA change without turning it into a witch hunt
The departments that improve fastest aren't the ones with the strictest peer review. They're the ones that measure quickly, feed results back without blame, and resist overreacting to a bad month that's really just a small sample doing what small samples do. Weaponizing peer review, tying it to performance reviews or compensation, reliably produces underreporting, and underreporting is worse than a high discrepancy rate because you lose the ability to see the problem at all.
If you're starting from nothing, spend the first 90 days on three things: agree on definitions, run a genuine baseline audit before changing anything, and pilot selective double reading on one high-risk modality. Everything else can wait until you know what you're actually measuring.
Rafael Vieira
Closing radiology coverage gaps with subspecialist support
Some departments close discrepancy gaps by hiring more staff radiologists or restructuring internal call schedules. Both work, but both take months to execute and carry fixed costs regardless of volume. AstraRad offers a faster lever for the specific gaps that drive discrepancy risk: overflow volume, after-hours coverage, and subspecialist deficits in modalities like MRI where local expertise is thin.
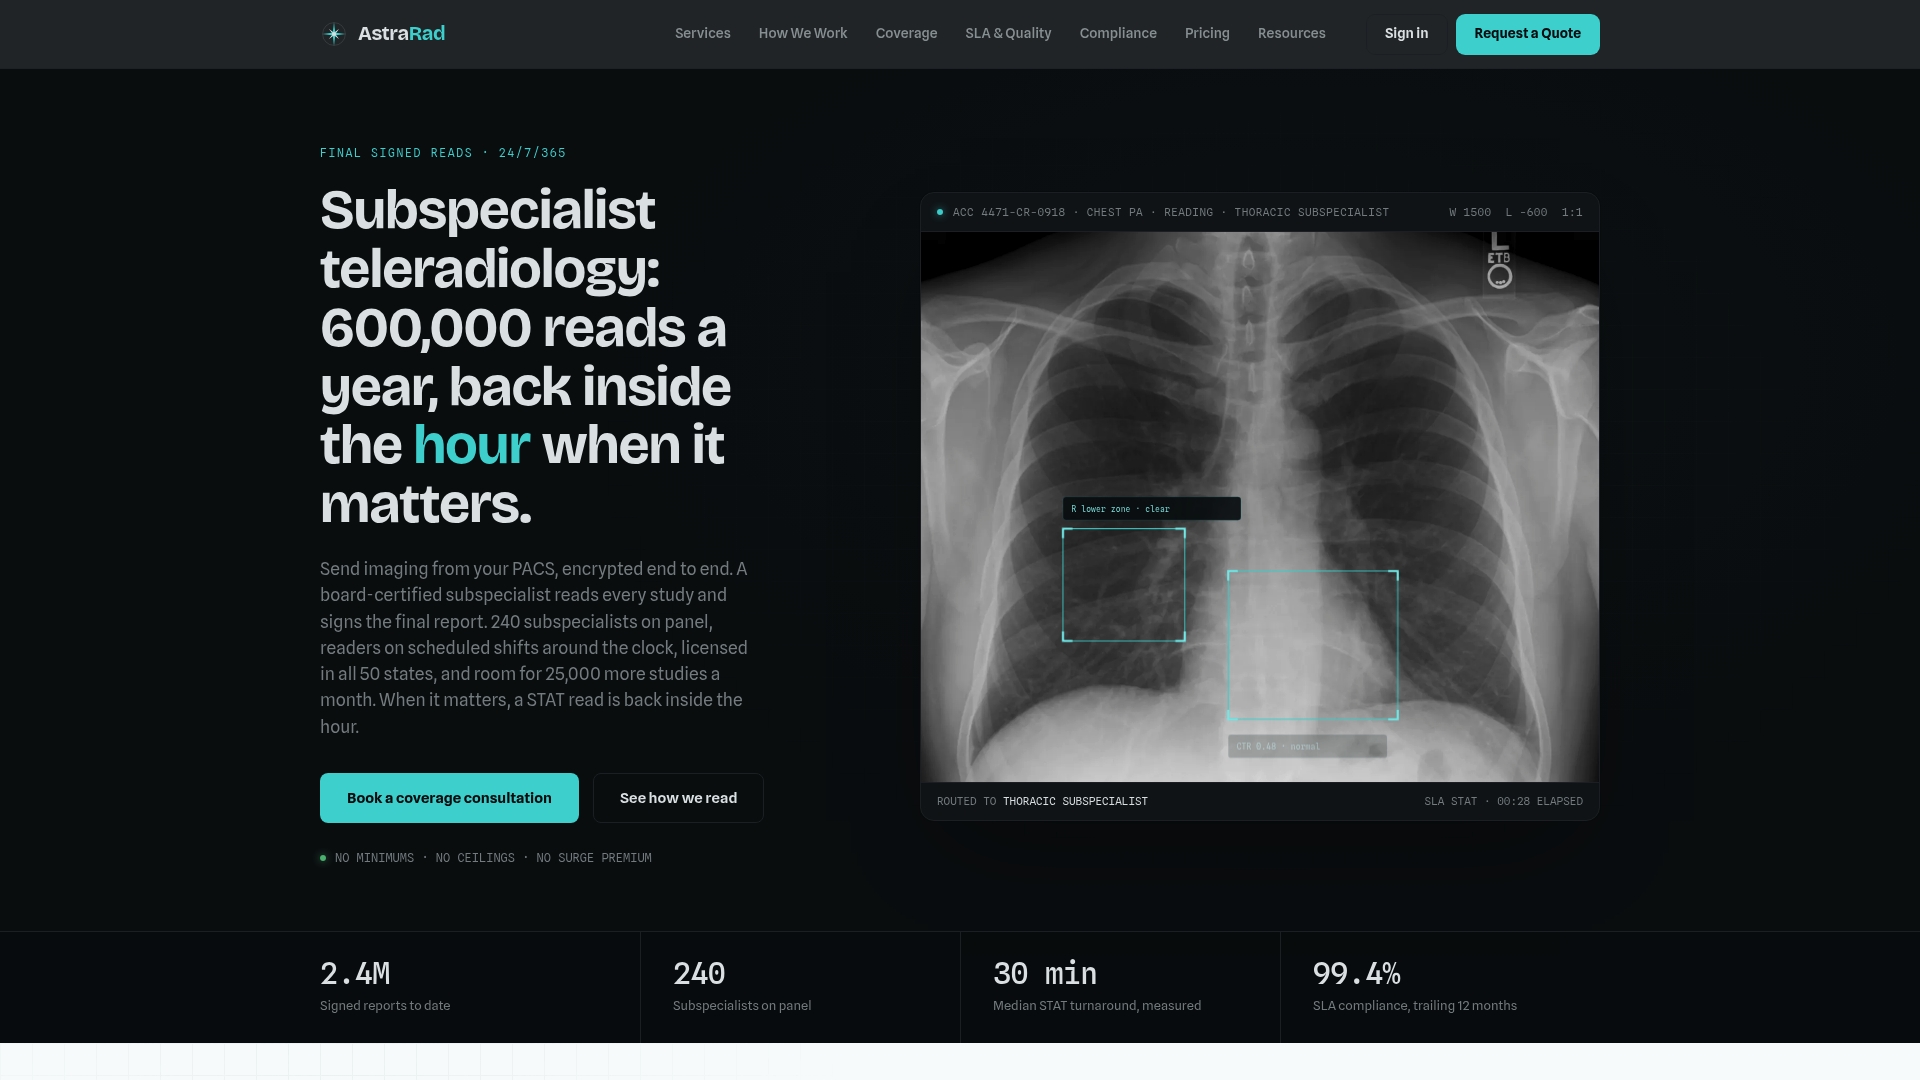
Every study is read by a board-certified subspecialist in that modality, with guaranteed turnaround under 1 hour for STAT cases and under 24 hours for routine studies, backed by peer review processes and per-report pricing that scales with your actual volume instead of a fixed staffing cost. That combination matters most in the exact coverage windows this article flagged as highest risk: overnight, weekends, and any period where workload per reader climbs past your normal baseline. If your department is fielding overflow volume or gaps in MRI subspecialist coverage, check AstraRad's per-report pricing and current state licensing coverage to see whether it fits your QA plan for the next quarter.
Sources
For designing your own audit, start with Brady's foundational review and the 2023 resident discrepancy audit.
This article is general information, not a substitute for advice from a qualified doctor. Consult a qualified healthcare professional about your own circumstances before acting on anything here.
- Error and discrepancy in radiology: inevitable or avoidable? (AP Brady, 2016)
- Cognitive and system factors contributing to diagnostic errors in radiology (AJR)
FAQ
What is the typical error rate among radiologists?
Real-time, day-to-day reporting shows a discrepancy rate of roughly 3 to 5% of studies, while retrospective double-read audits often find discordance between 20 and 30%, especially in cross-sectional imaging.
What is the 15% rule in radiology?
There's no established "15% rule" in the peer-reviewed radiology literature; discrepancy rates vary too much by modality, audit design, and reader seniority to reduce to a single fixed percentage.
How often do radiologists misdiagnose?
Misdiagnosis frequency depends heavily on how it's measured: routine single-read reporting shows discrepancy rates near 3 to 5%, while audits using a second, often blinded, reader find considerably higher rates because they're designed to surface disagreement that routine practice doesn't catch.
What is the most common error in radiology?
Perceptual errors, missing a finding that's visible on the images, account for roughly 60 to 80% of diagnostic misses, outnumbering cognitive or interpretative errors where the finding is seen but misjudged.
How does outsourcing overflow reads affect discrepancy risk?
Routing overflow or after-hours volume to subspecialist teleradiology, such as AstraRad's board-certified reads with guaranteed turnaround, addresses the workload spikes that the work overload research links to higher perceptual error rates.
Recommended
Related on AstraRad
- Resources
STAT radiology reads: routing, escalation, and QA
How to run STAT radiology reads as a program: order discipline, routing rules, turnaround benchmarks, escalation paths, and quality control that holds.
- Resources
Musculoskeletal teleradiology with 99.4% SLA and PACS
Imaging centers get fellowship trained musculoskeletal teleradiology reads with PACS integration, SLA backed turnarounds, and STAT results under one hour.
- Resources
Cut teleradiology credentialing to under 21 days
Checklist for hospital admins: verify licenses, privileging, payer enrollment, MOUs and PACS provisioning to cut teleradiology go live from 60,120 days
Put a radiologist's name on your next read.
Tell us your modalities and monthly volume. A complete per-report rate card, with turnaround tiers and SLA terms in writing, lands in your inbox within one business day.