Teleradiology turnaround times for hospitals
Teleradiology turnaround times: SLA benchmarks, contract wording, and operational fixes that help hospitals set and enforce STAT and routine targets.

Published industry benchmarks put STAT reads at 30 to 60 minutes, urgent studies at two to six hours, and routine outpatient reports at same-day to under 24 hours, depending on how a facility defines the clock. These are market benchmarks, not AstraRad's contract tiers, which are set out on the SLA page. National data show these numbers have been sliding the wrong direction, so the first move for any administrator is locking down a standard turnaround time (TAT) definition and building it into every teleradiology contract you sign.
TL;DR:
- Teleradiology typically offers turnaround times under 60 minutes for STAT, two to six hours for urgent cases, and under 24 hours for routine outpatient reports.
- Accurate measurement relies on defining the start point from image availability to report signing and benchmarking against national data such as NRDR/GRID, not vendor median times.
- Staffing shortages, workflow inefficiencies, and technical issues like PACS routing and DICOM errors are the main drivers of delays, especially after hours and in lower-income communities.
- Guaranteed SLA targets should specify time frames, tiered goals, measurement methods, and escalation clauses, with a common benchmark being STAT under 60 minutes at 95% compliance.
- Implementing operational fixes like standardizing order templates, improving PACS routing, and ensuring dedicated STAT slots can rapidly reduce turnaround times before investing in advanced technology.
Table of Contents
- Teleradiology Turnaround Times By Urgency And Modality
- What Turnaround Time Actually Measures
- What's Actually Driving Long Turnaround Times?
- How Teleradiology Actually Shortens Turnaround Time
- How To Write SLA Language That Actually Holds Providers Accountable
- Operational Fixes That Cut Turnaround Time Fast
- Why National Turnaround Data Should Worry You
- What Actually Moves The Needle On Turnaround Time
- Get Committed Turnaround Times With A Teleradiology Partner
- Where To Verify These Benchmarks Yourself
- Sources
Teleradiology Turnaround Times By Urgency And Modality
Numbers only matter if you're measuring the same thing your teleradiology partner is measuring. That's the trap most facilities fall into: they compare their internal report against a vendor's advertised median without checking whether both clocks start at the same point.
Here's what functional benchmarks look like across urgency tiers, based on peer-reviewed teleradiology performance data and typical contract language administrators should expect:
- STAT/emergency: Target under 30 to 60 minutes from image availability to preliminary or final report, with tighter targets in trauma and stroke protocols.
- Urgent: Two to six hours is standard for non-life-threatening but time-sensitive findings, such as suspected fractures or acute abdominal pain workups.
- Routine outpatient: Same-day to under 24 hours is the accepted range, though many contracts still allow up to 48 hours for low-acuity studies.
Modality changes the math. A pediatric emergency neuroimaging study found mean turnaround of about 37.5 minutes for CT and 61.2 minutes for MR across nearly 10,000 scans from 107 hospitals. Ultrasound and plain radiography typically move faster on the acquisition side but can lag on interpretation when subspecialist availability is thin, particularly overnight.
What Turnaround Time Actually Measures
Most disputes between hospitals and radiology providers trace back to a definition gap, not a performance gap. Before you sign anything or audit anything, settle these three questions:
- Where does the clock start and stop? AstraRad and most credible providers recommend measuring from image availability in PACS to the final signed report, not from order entry, which inflates numbers with scheduling delays outside the radiologist's control.
- Which metrics do you track? Median TAT tells you the typical case. SLA compliance percentage tells you how often the provider hits the promised target. Bucket reporting (under 1 hour, under 4 hours, under 24 hours, over 24 hours) exposes tail delays that a median can hide entirely.
- Where do you benchmark against? The NRDR/GRID Quarterly Facility Report gives facility-level TAT buckets by modality, letting you compare your program against ACR's national registry data instead of guessing.
Report percentiles alongside medians. A provider with a fast median but a wide 95th percentile is hiding surge failures.
What's Actually Driving Long Turnaround Times?
Delays rarely come from one cause. They stack. Staffing gaps top the list, especially after-hours coverage where a single on-call radiologist handles emergency department volume across multiple facilities simultaneously.
Workflow failures come next. Missing clinical history on an order forces a callback before a radiologist can safely interpret the study, and that back-and-forth eats minutes that add up fast during a busy overnight shift. Prioritization breakdowns matter too: without a clean triage code, a routine chest X-ray can sit in the same queue as a STAT head CT.
Technical bottlenecks compound both problems:
- Incomplete PACS routing that sends studies to the wrong worklist
- Speech-recognition software failures that force manual dictation and re-transcription
- DICOM header errors that stall automated triage rules before a radiologist ever sees the case
Regulatory timing adds another layer. The 21st Century Cures Act changed when patients see finalized reports, which is a separate clock from when the ordering physician receives them, and confusing the two skews your internal reporting. National analysis also shows longer TATs concentrated in lower-income communities, a pattern worth flagging in any capacity planning conversation.
Tail delays reveal the specific handoff or system failure that's actually costing you compliance, while averages just smooth it over.*
How Teleradiology Actually Shortens Turnaround Time
Teleradiology's speed advantage isn't magic. It comes from removing the variability baked into on-call scheduling and replacing it with dedicated routing across a distributed radiologist pool. When one radiologist covers three hospitals on call, volume surges create bottlenecks nobody planned for. A teleradiology network spreads that load and keeps subspecialists available around the clock instead of on a rotation.
A comparative analysis found average delay from referral to reporting dropped to 1 hour 1 minute with teleradiology versus 1 hour 35 minutes under an on-call onsite model.
Contractual tiers: AstraRad's contract commits to STAT reads under 4 hours, with 2-hour and 1-hour STAT available on request at a higher multiplier, and routine studies in 24 to 48 hours, with 1 in 20 reports independently double-read, blind.
That performance rests on three mechanisms:
- 24/7 subspecialist coverage that removes the single-radiologist bottleneck common in smaller on-call groups
- Surge routing logic that redistributes volume automatically when one facility spikes
- Board-certified subspecialty matching, so a neuro case goes to a neuroradiologist rather than whoever is next in the general queue
The caveats matter just as much. Image quality issues, incomplete studies, and state licensure restrictions can all slow a remote read regardless of how efficient the routing is, so integration quality determines how much of that theoretical gain you actually capture.
How To Write SLA Language That Actually Holds Providers Accountable
Vague SLA language is worse than none, because it gives both sides room to argue after something goes wrong. Build these elements into every contract:
- A single TAT definition, specified as image-availability-to-final-report, applied identically across every tier.
- Tiered targets by urgency, with STAT, urgent, and routine each carrying separate numeric commitments.
- A measurement method, stating whether compliance is calculated on median, mean, or percentile, and over what rolling window.
- Reporting cadence, ideally monthly, with a minimum sample size so a slow week doesn't get buried in a quarterly average.
- Escalation and remediation clauses, defining what happens when compliance drops below the target for two consecutive reporting periods.
Target ranges worth writing into a contract: STAT under 60 minutes at 95% compliance or higher, routine under 24 hours at 98% or higher. Anything below 95% compliance on STAT reads should trigger a documented remediation conversation, not a quiet renewal.
Pro Tip: Ask any prospective provider for a sample SLA performance report before signing. If they can't produce one with real bucket data, that's your answer.
Operational Fixes That Cut Turnaround Time Fast
Some fixes cost nothing but discipline. Others require investment. Sequence them that way.
Immediate, low-cost moves:
- Standardize order templates so clinical history is a required field, not optional
- Implement clear triage codes at order entry so STAT cases never sit in a general queue
- Audit your current TAT reporting to confirm you're measuring image-availability-to-report, not order-to-report
Medium-term technical investments include PACS routing rules that auto-prioritize by triage code, single-sign-on integration that removes login friction for remote radiologists, and automated alerts when a case approaches its SLA deadline rather than after it breaches. Staffing fixes matter equally: ring-fenced STAT slots guaranteed per shift, and distributed overnight coverage that doesn't rely on a single physician handling every facility on call.
AI triage tools can help sort incoming studies by likely acuity, but they work best as a sorting layer feeding human review, not a replacement for radiologist judgment on borderline cases.
Why National Turnaround Data Should Worry You
The trend line is not encouraging. National imaging interpretation turnaround time rose 27% between 2023 and 2024 alone, and 177% cumulatively from 2014 to 2024, with CT and MR among the modalities showing the steepest climbs.
The Neiman Health Policy Institute's Medicare claims analysis found the 2024 jump wasn't a one-year blip. It sits on top of more than a decade of steady acceleration, meaning short-term staffing patches alone are unlikely to reverse it without structural capacity changes.
Separately, research tied to the Cures Act found that patient access to finalized reports shifted meaningfully after the regulation took effect, a reminder that report release timing and interpretation timing are two different clocks worth tracking separately. Combined with evidence that delays concentrate in lower-income communities, the trend has real workforce planning and equity implications that administrators can't plan around with wishful thinking.
What Actually Moves The Needle On Turnaround Time
Most hospitals overestimate what a single technology purchase will fix and underestimate what a clean workflow audit will fix. Here's a realistic 30 to 90 day sequence.
In the first 30 days, standardize your TAT definition across every reporting system you use, audit your worst 5% of cases by delay, and require clinical history on every order. In the next 30 to 60 days, negotiate or renegotiate SLA language with explicit tiers and measurement methods, and pilot ring-fenced STAT capacity with your teleradiology partner. Beyond 90 days, build monthly compliance reporting into your quality committee agenda, and stop treating it as an annual exercise.
A common integration pitfall isn't radiologist availability. It's incomplete PACS routing rules that send studies to the wrong worklist, or missing DICOM header fields that block automated triage before a human ever touches the case. Fix the data plumbing before you evaluate radiologist speed.
Get Committed Turnaround Times With A Teleradiology Partner
AstraRad exists because most hospitals don't need another on-call rotation gamble. They need a partner that commits to the number in writing: STAT reads under 4 hours, 2-hour and 1-hour STAT on request, routine studies in 24 to 48 hours.
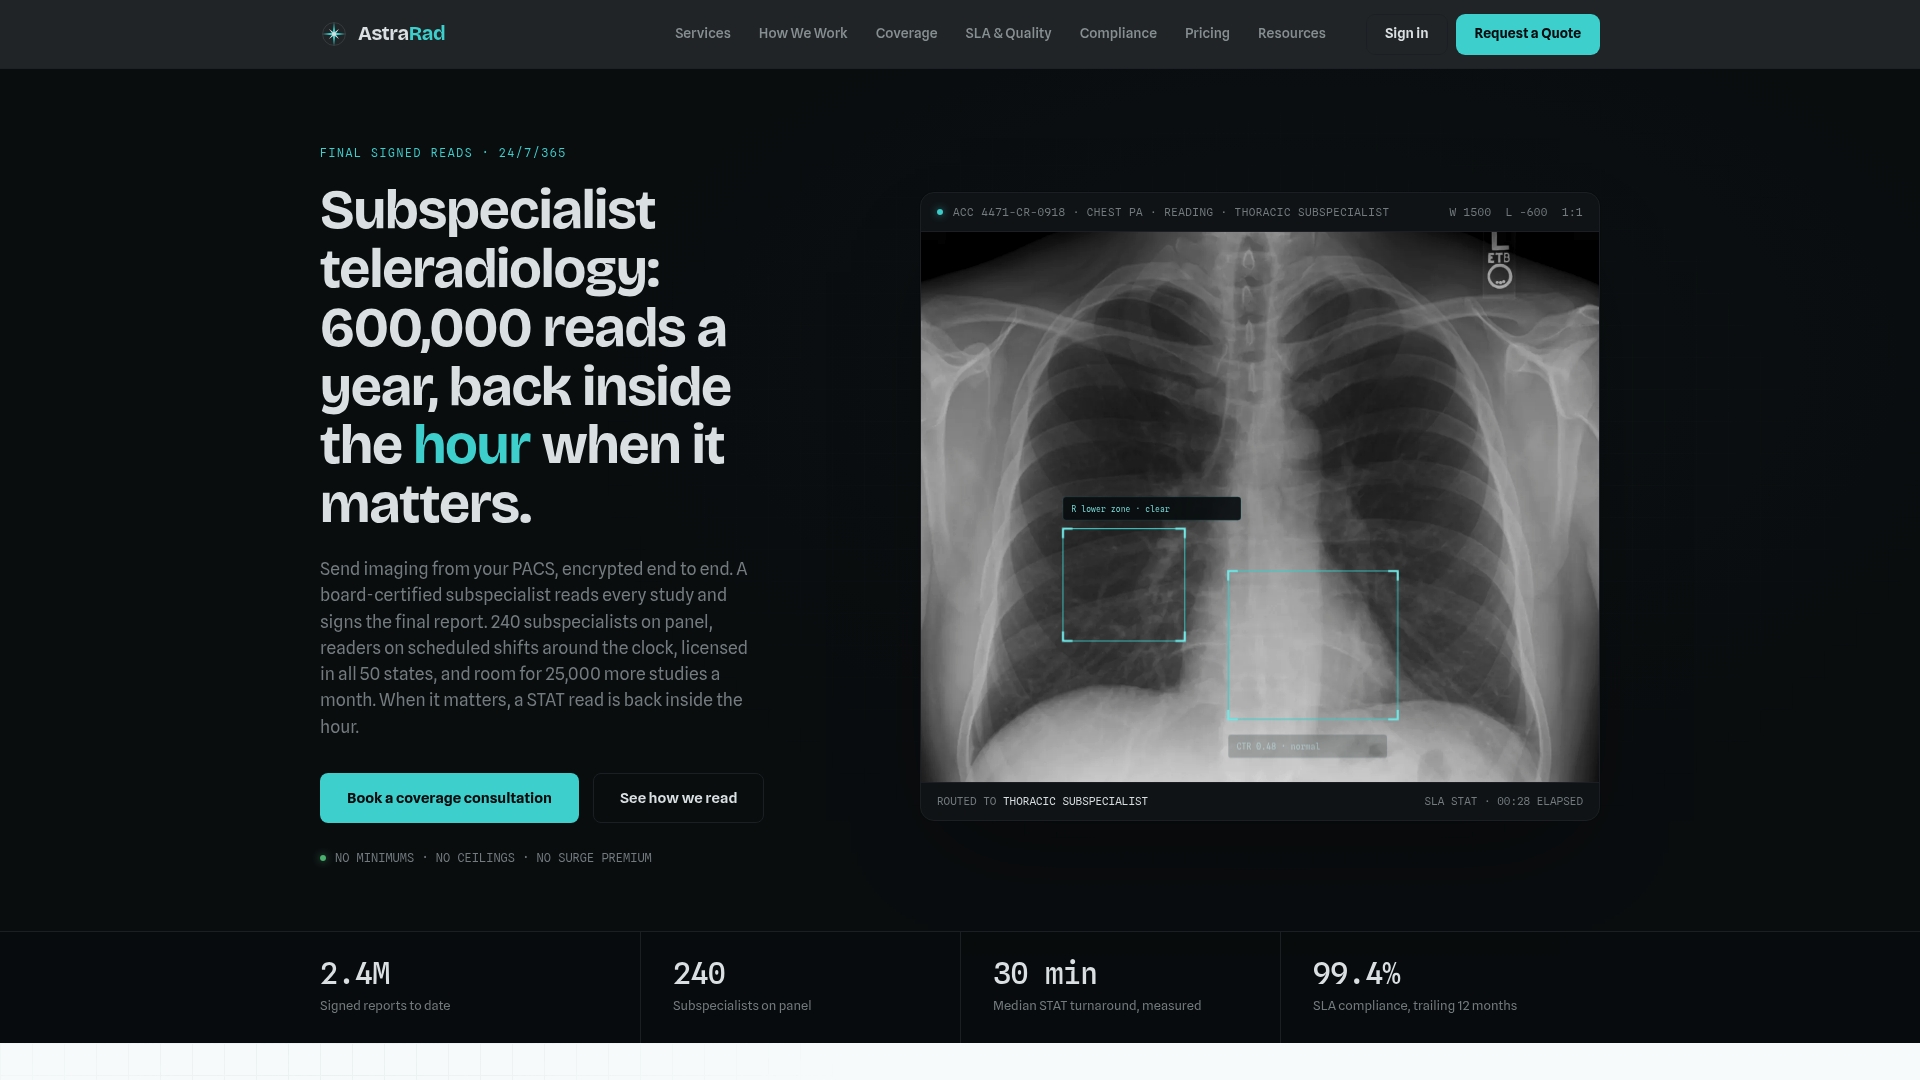
Every study is read by a US board-certified subspecialist matched to the modality, with peer review built into the process rather than bolted on afterward. Integration runs through your existing PACS, so there's no new portal for your staff to learn and no workflow disruption during onboarding. Whether you're covering overnight ED overflow, clearing a routine backlog, or filling a subspecialty gap, the per-report pricing model scales with your actual volume instead of locking you into a flat rate for capacity you might not use.
If you want to see how this performs against your own SLA targets before committing, start a short pilot and measure it from your own timestamps.
Where To Verify These Benchmarks Yourself
Cross-check any vendor's claims against primary sources. The Neiman Health Policy Institute publishes national TAT trend data, while ACR's NRDR/GRID reports let you benchmark your facility's own bucketed performance by modality against peer institutions.
This article is general information, not a substitute for advice from a qualified doctor. Consult a qualified healthcare professional about your own circumstances before acting on anything here.
Sources
- Performance of a multistate teleradiology service in emergency pediatric and adolescent neuroimaging: a two-year retrospective study
- Comparative study showing teleradiology vs on-call reporting delays
- Time for Patients to Access Their Reports Before vs After 21st Century Cures Act Implementation
Recommended
Related on AstraRad
- Resources
2027 Medicare fee schedule: the radiology numbers explained
The CY2027 Medicare fee schedule cuts both conversion factors while ACR estimates radiology gains 2 percent. Both are true. Model your dollars per RVU.
- Resources
Radiology addendum policy: how to write one that works
A radiology addendum policy defines when to amend a signed report, who notifies the ordering provider, and how you audit it; here is how to write one.
- Resources
Clinician-radiologist communication: closing the loop
Clinician-radiologist communication fails when critical results reach a system but never reach the physician, and closed-loop standards close that gap.
Put a radiologist's name on your next read.
Tell us your modalities and monthly volume. A complete per-report rate card, with turnaround tiers and SLA terms in writing, lands in your inbox within one business day.